
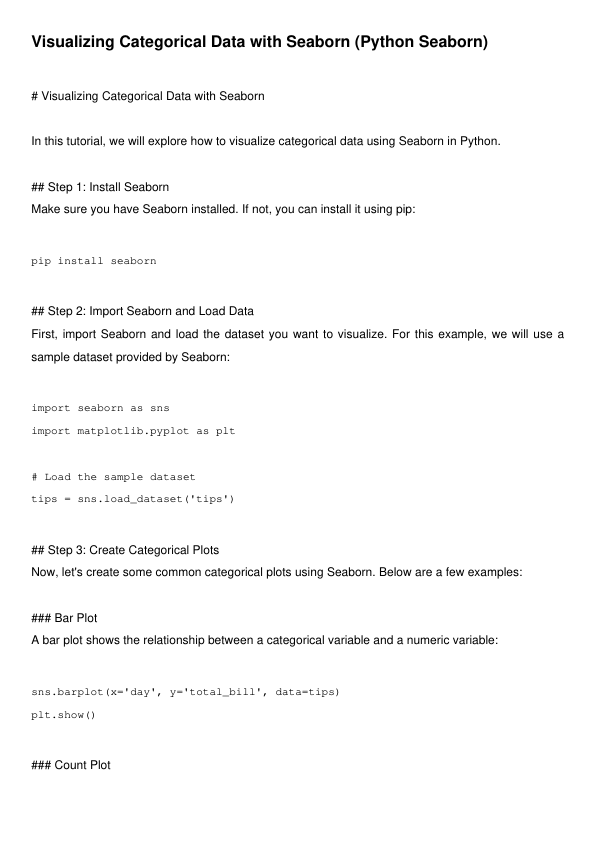


Mastering Seaborn: The Ultimate Guide to Data Visualization in Python
Perfect for data scientists, analysts, students, and Python enthusiasts, this guide blends clear explanations, step-by-step tutorials, and real-world examples to help you craft stunning, informative visuals.
Inside you’ll discover:
Basics of Seaborn and plotting essentials
Statistical visualizations with ease
Customizing colors, themes, and layouts
Creating heatmaps, pair plots, regression plots, and more
Tips for effective visual storytelling
Whether you’re polishing reports, exploring data, or building dashboards — this guide is your go-to Seaborn reference.
1 PDF File (This is a Digital Product and no Physical product will be delivered)


Reviews
There are no reviews yet.